Histogram
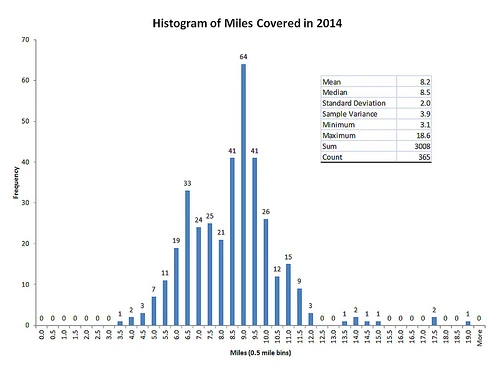
A histogram is one of the seven basic quality tools. It is one way to visually portray data. A histogram can be useful in identifying trends which can then be verified statistically. This can help measure whether quality improvements are having the desired effect or whether deliverables are meeting requirements.

Stacked histogram
Related: Plan quality management, tools and techniques, control quality, additional quality planning tools, quality management and control tools, bar chart